Daily Efficiency Tracker
Last updated: December 24, 2025
How to access:
Login to your P360 account > Daily Efficiency Tracker
Overview:
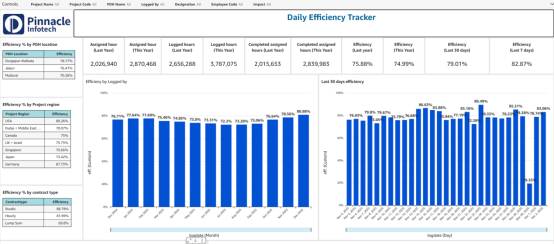
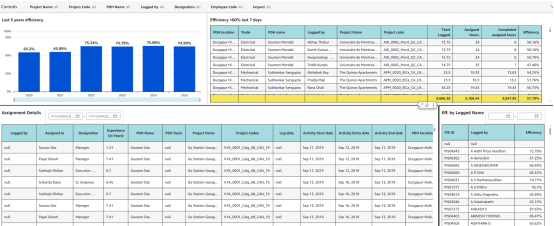
The Daily Efficiency Tracker Dashboard is used to monitor and track employee efficiency across different PDH locations, regions, and contract types. It displays data for the current and past year, as well as recent efficiency trends (last 30 days and last 7 days). It also includes bar charts to display efficiency trends over different periods (monthly, daily, and yearly), helping users visualize performance fluctuations and trends.
Key Sections:
Efficiency by PDH Location: Shows the efficiency percentage by PDH location.
Efficiency by Project Region: Displays efficiency percentages by different regions.
Efficiency by Contract Type: Displays efficiency based on contract types, such as Studio, Hourly, and Lump Sum.
Last 30 Days Efficiency: This chart provides a visual representation of efficiency over the past 30 days. Each bar represents a day’s efficiency percentage.
Last 7 Days Efficiency: A similar representation but specifically for the last 7 days.
Efficiency by Logged Name: Efficiency for each employee based on their logged activities, including names and efficiency percentages.
Note: Efficiency = Assigned hours vs. Logged hours