Project KPI Summary
Last updated: January 7, 2026
How to access:
Login to your P360 account > Project Dashboard > Project KPI Summary
Overview:
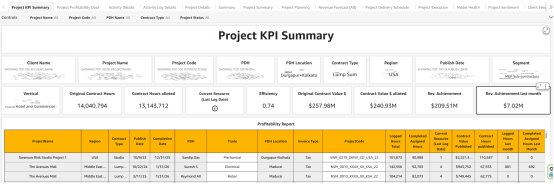
The Project KPI Summary Dashboard provides a high-level view of overall project performance, efficiency, and financial health in one place. It allows users to filter data by project name, project code, PDH name, contract type, and project status to focus on specific projects or teams.
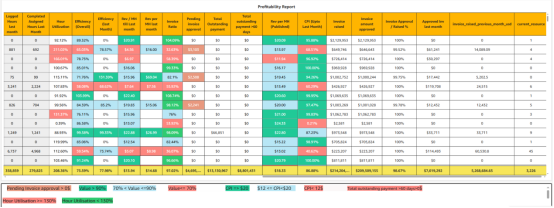
The profitability report section gives detailed insights into logged and completed hours, hour utilization, efficiency trends, revenue per man-hour, invoice status, and outstanding payments. Color indicators are used to quickly highlight performance, where green indicates good performance, blue shows acceptable levels, and red signals areas that need immediate attention, such as low efficiency, high hour utilization, pending invoice approvals, or payments overdue by more than 60 days.
Overall, this dashboard helps management, PDHs, project managers, and finance teams quickly understand project health, identify risks, and take timely corrective actions.
Key sections:
Efficiency: Assigned hours vs. Logged hours
Rev per MH: Sum of Invoice Raised vs. Sum of logged Hours
Rev per MH (Published): Sum of Contract Value vs. Sum of Contract hours
Invoice Ratio: (Invoice Raised vs Contract Value) vs (logged Hours vs Contract hours)
CPI: Rev per MH vs Rev per MH (Published)
Invoice Approval / Raised %: Invoice Approved vs Invoice Raised